

In Brief
High-res head shot
A new way to see the brain’s connections
By Bruce Goldman
Image courtesy of Stephen Smith
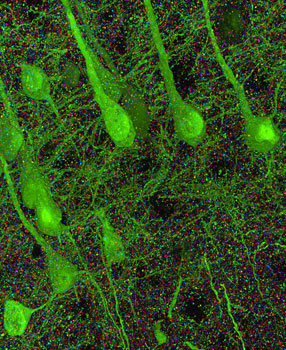
This visual reconstruction shows the synapses in the mouse somatosensory cortex, the region responsive to whisker stimulation. Neurons are depicted in green; multicolored dots represent separate synapses.
It’s mind-boggling. A typical human brain contains about 200 billion neurons linked to one another via hundreds of trillions of tiny connections called synapses. These connections form the circuits behind thinking, feeling and moving — yet they’re so abundant and closely packed that getting a precise handle on what’s where has defied scientists’ best attempts.
But here comes a solution. Stephen Smith, PhD, professor of molecular and cellular physiology, and Kristina Micheva, PhD, a senior staff scientist in Smith’s lab, have invented a technique that quickly locates and counts the synapses in unprecedented detail, and reveals their variations. They described the imaging system, called “array tomography,” in the Nov. 18, 2010, issue of Neuron.
Attempting to map the cerebral cortex’s complex circuitry has been a fool’s errand up to now, Smith says. “We’ve been guessing at it.” Synapses in the brain are crowded so close together that they cannot be reliably resolved by even the best of traditional light microscopes, he says.
In particular, the cerebral cortex — a thin layer of tissue on the brain’s surface — is a thicket of prolifically branching neurons. “In a human, there are more than 125 trillion synapses just in the cerebral cortex alone,” says Smith. That’s roughly equal to the number of stars in 1,500 Milky Way galaxies, he notes.
Here’s how Smith, Micheva and their colleagues carried out the technique for the demonstration published in Neuron: A slab of tissue — in this case, from a mouse’s cerebral cortex — was carefully sliced into sections only 70 nanometers thick. These ultrathin sections were stained with antibodies designed to match 18 different synapse-associated proteins, and they were further modified by conjugation to molecules that respond to light by glowing in different colors.
The antibodies were applied in groups of three to the brain sections. After each application, huge numbers of extremely high-resolution photographs recorded the locations of different fluorescing colors associated with antibodies to different synaptic proteins. The antibodies were then chemically rinsed away and the procedure was repeated with the next set of three antibodies, and so forth. Each individual synapse thus acquired its own protein-composition “signature,” enabling the compilation of a very fine-grained catalog of the brain’s varied synaptic types.
The team created software that virtually stitched together all the slices in the original slab into a three-dimensional image that can be rotated, penetrated and navigated. The researchers were able to “travel” through the resulting 3-D mosaic and observe different colors corresponding to different synaptic types just as a voyager might transit outer space and note the different hues of the stars dotting the infinite blackness.
This level of detailed visualization has never been achieved before, Smith says. “The entire anatomical context of the synapses is preserved. You know right where each one is, and what kind it is,” he says.
Observed in this manner, the brain’s overall complexity is almost beyond belief, says Smith. “One synapse, by itself, is more like a microprocessor — with both memory-storage and information-processing elements — than a mere on/off switch. In fact, one synapse may contain on the order of 1,000 molecular-scale switches. A single human brain has more switches than all the computers and routers and Internet connections on Earth,” he says.